Data Visualization with R – Step-by-Step Instructions
This post covers the details of how to use R to generate data visualizations. We will use a sample data set that includes about 800 tweets using hashtag “#edutech” for the purpose of explanation. To learn how this data set was collected read my post A Peek Into Text Mining: How To Collect Data From Twitter.
Text data has to be converted into a document-term matrix for analysis. To convert our sample data set into a document-term matrix, you need to do the following things:
- Copy and paste all the codes in the file termDocumentMatrixConverter.R to your console of R, and run the codes.
- Run the following code in R console. Please remember to replace the filename with the name of your file (without csv suffix).
data

data

data.tm
Now your document-term matrix is saved in a variable called data.tm for future use.
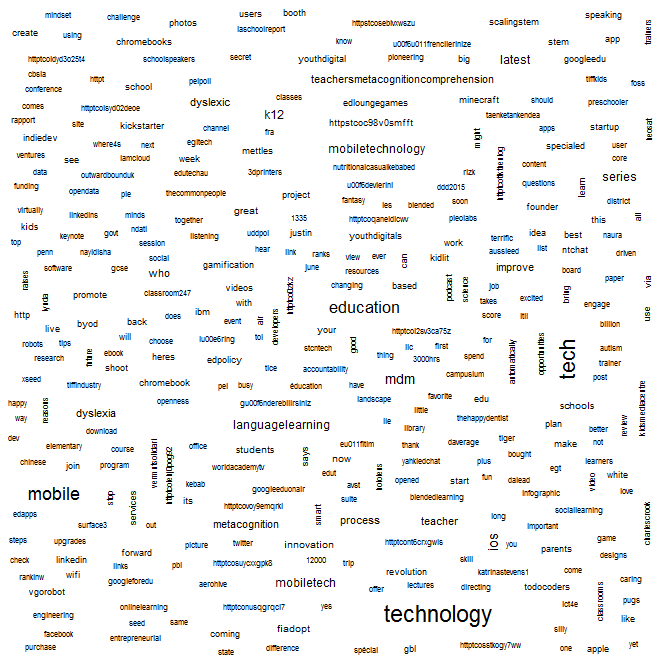
Word Cloud
A word cloud is very helpful if you want to take a quick look at your data. To generate a word cloud, please run the following code in your R console:
# word cloud
install.packages("wordcloud")
library(wordcloud)
# word cloud function can only be run on PlainTextDocument
wordcloud(data)
This code will generate a word cloud. The generation of the word cloud may take some time.
Cluster Tree
Cluster analysis is a way of finding association between items and bind nearby items into groups. A typical visualization technique is a tree diagram called dendrogram. Before applying hierarchical clustering to the data, we will need to remove the the terms that only appear once. When we get the clusters, we will need to plot it to see the dendrogram. All in all, run the codes in hclusterofwords.R file first, and then run the following code in your R console.
hclusterofwords(data.tm)
Your dendrogram may look like this:
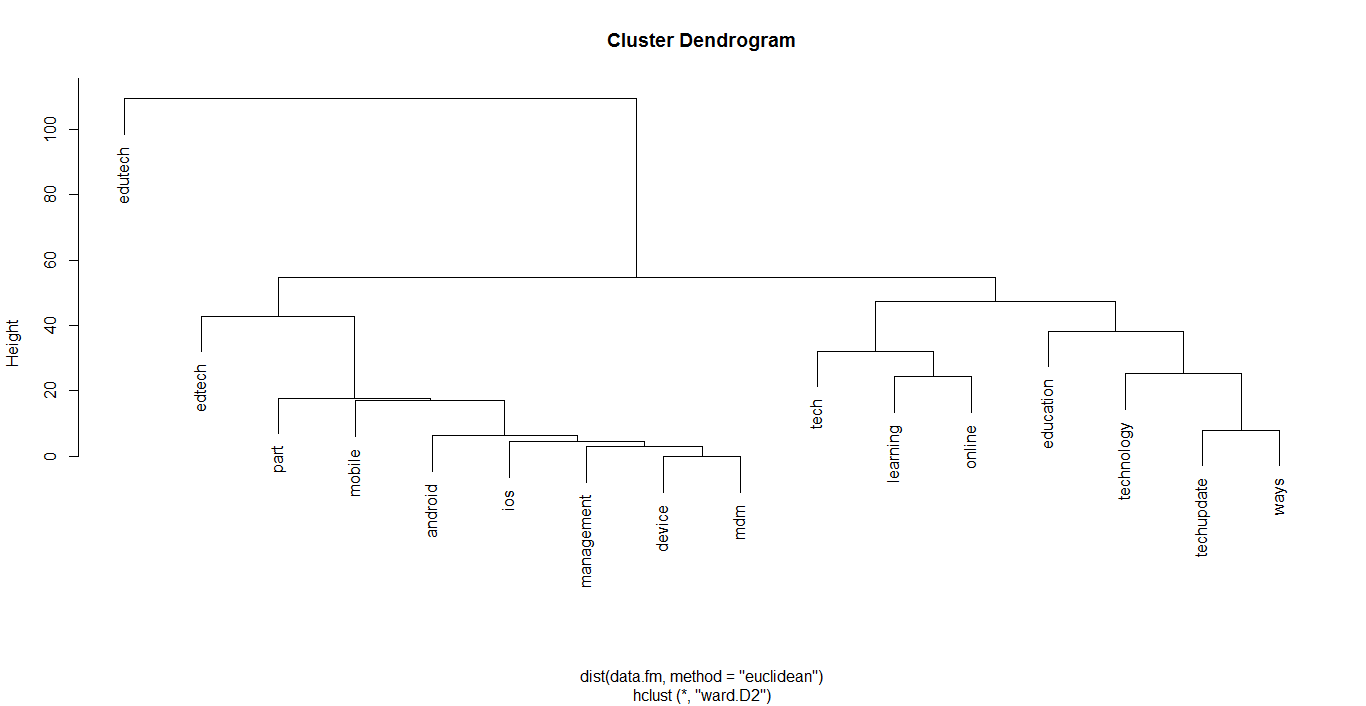
To learn more about clustering analysis visit the open access book and website The Elements of statistical learning.
