Interactive Infographics with Tableau: Data Snap
Data Snap was developed by the Criminal Justice Innovation Lab at the University of North Carolina at Chapel Hill
Infographics display information in engaging and interactive formats that allow audiences to manipulate and explore data. They may help grab people’s attention based on color and design and make data easier to process. There are various different products for data visualization. This article explains how we used Tableau Public to turn diverse datasets into complex charts that illuminate policy issues and evidence-based support decision making (http://go.unc.edu/datasnap).
Tableau (public) is a combination of a downloadable app available for Windows and Mac and a web-based display platform for interactive data visualizations. Tableau Public may be used free of charge for the open access display data charts and dashboards – for restricted use the paid license is required. The tableau platform provides an extensive library of data visualizations that have been created by other users.
Tableau offers a wide variety of options including pie, bar and bubble charts, maps, heat maps and scatter plots that can be combined into interactive dashboards that allow users to drill down into charts and compare different data points with ease.
For the ‘Data Snap’ project, Carolina’s Kenan-Flagler Business School student Spencer Stone worked under the guidance of Professor Jessie Smith from the Criminal Justice Innovation Lab at UNC School of Government.
When Jessie Smith stopped by my office several months ago with an idea for ‘visualizing data points so that you can compare counties on the North Carolina map’ I had no idea about both the amount of work and the tremendous possibilities that lay ahead. The best part of this project is that the data visualization was completed by one of our IT student interns, who in the course of this project, offered a Tableau training to the whole department.
Let’s hear from Spencer:
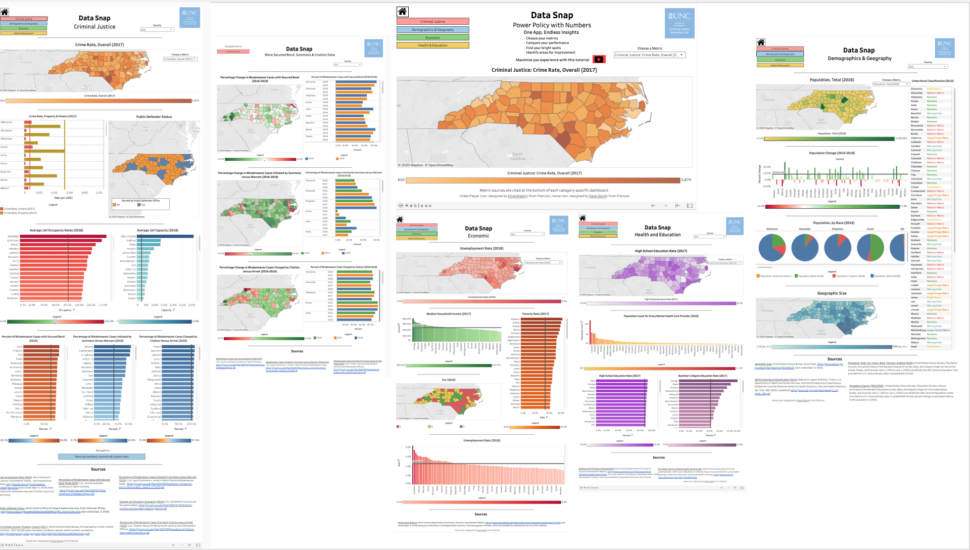
Data Snap: Power Policy with Numbers is the culmination of many months of work collecting data and transforming that data into approachable, easy to access graphs in Tableau Public. Through the duration of the project, I worked closely with Jessica Smith, the Director of the School of Government’s Criminal Justice Innovation Lab to make this idea come to life. The Criminal Justice Innovations lab has troves of data it has collected; however, the data does not have the same impact in an Excel spreadsheet as it does in vivid, interactive maps and charts. The Tableau tool I have built allows users to choose a metric, compare counties to one another, and identify the areas where counties’ performance differs from others. The tool has a Home page, and category-specific Snap dashboards, including, Criminal Justice, Demographics & Geography, Economics, and Health & Education. We plan to update the tool moving forward, adding new data as it becomes available, and I am already working on a second version of the project!
Further Resources:
- Explore interactive infographics on Tableau Public
- Learn more about the work of the Criminal Justice Innovation Lab
- Read our expert interview about the effectiveness of interactive infographics
About the Authors
 Dr. Stefanie Panke is an instructional analyst at the University of North Carolina at Chapel Hill. She holds a PhD in applied linguistics for a thesis on the design and implementation of web-based educational resources. She has a passion for design thinking, and recently edited a special issue on the topic for Open Education Studies. As an edtech research specialist she keeps up-to-date of new trends and tools. Multimedia publishing formats and open platforms for data visualization play a growing role in her instructional design work.
 Spencer Stone is a rising senior at the University of North Carolina at Chapel Hill. He studies Business Administration at Kenan-Flagler Business School. His Areas of Emphasis comprise both Entrepreneurship and Operations Management and he is working in International Product Operations at Bandwidth this summer. Cullowhee, NC is Spencer’s hometown, and he grew up there hiking and camping in the Blue Ridge mountains. In his free time, Spencer enjoys watching and playing soccer, photography and photo editing, and hiking.
